
The All Bundles Performance table can be downloaded as a CSV file so you can sort, filter, and calculate in a spreadsheet. The file reflects exactly the date range and search filter active when you click export.
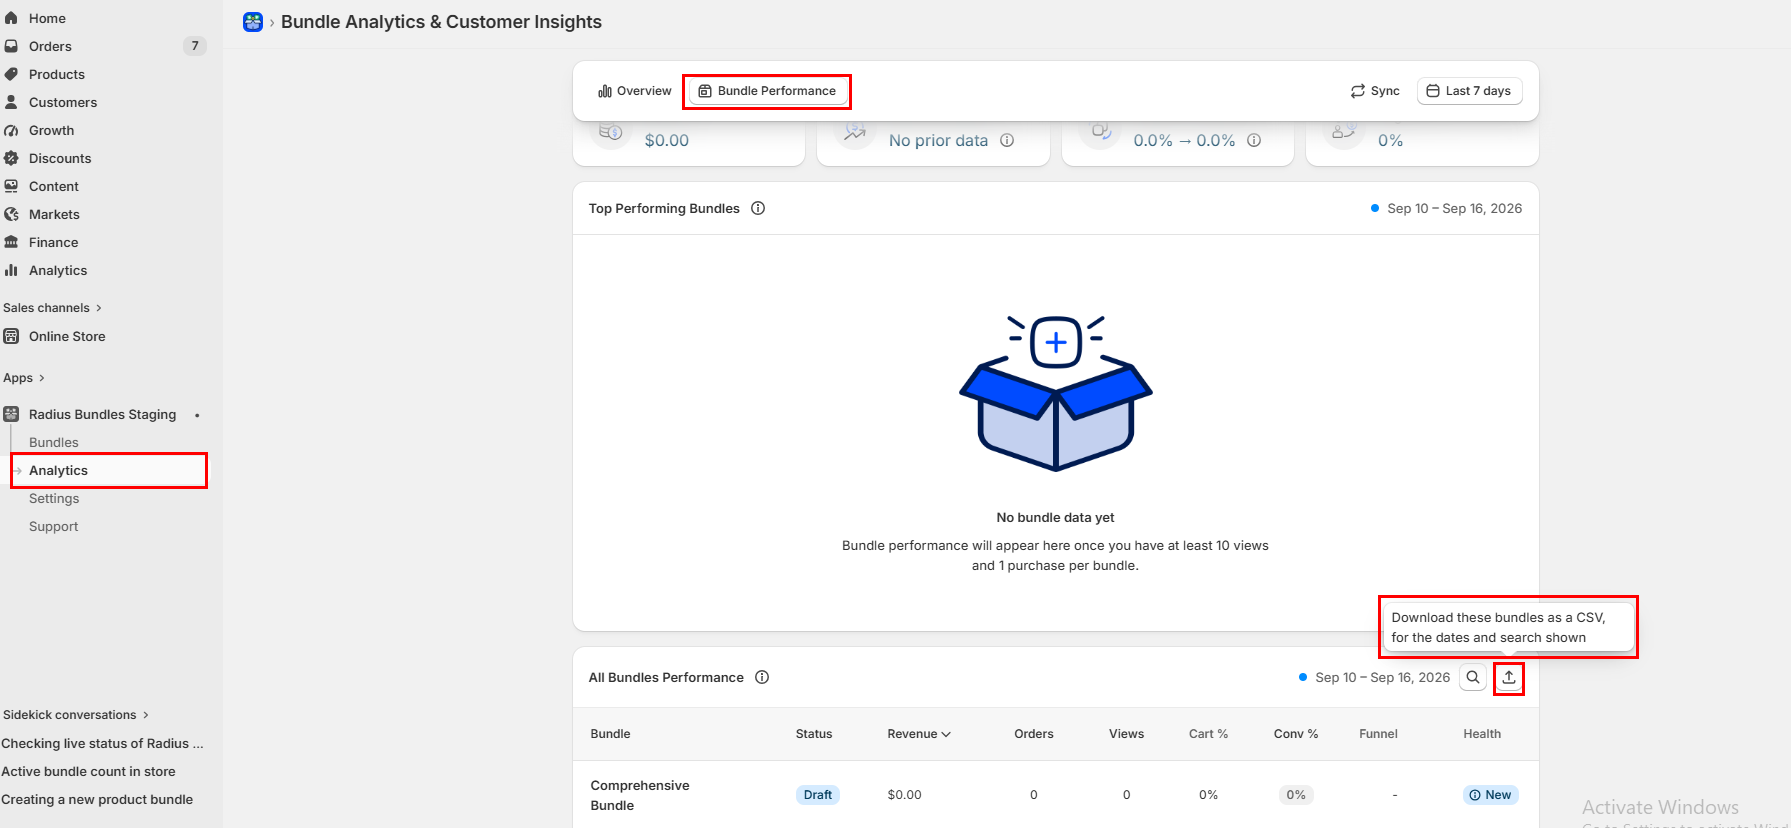
Where to Find It #
- Click
Analyticsin the left navigation. - Scroll to the All Bundles Performance section.
- Click the export icon button (top-right of the section, beside the search icon).
How to Export #
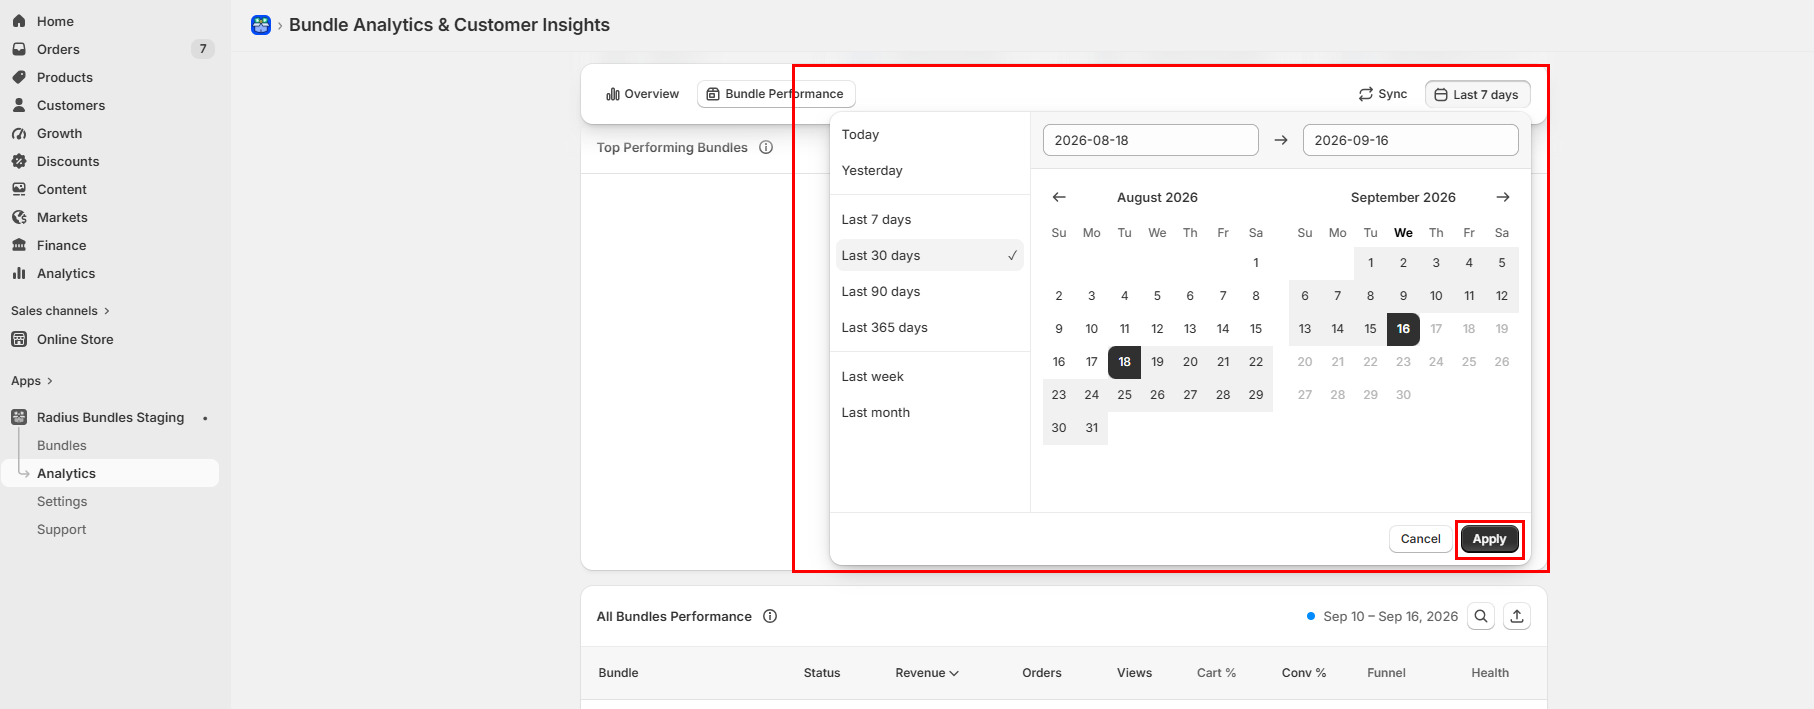
- Set the date range. Use the date picker at the top of the Analytics page. The file covers only the selected period.
- Filter by bundle (optional). Type in the search field to export a subset. Leave it blank to export every bundle.
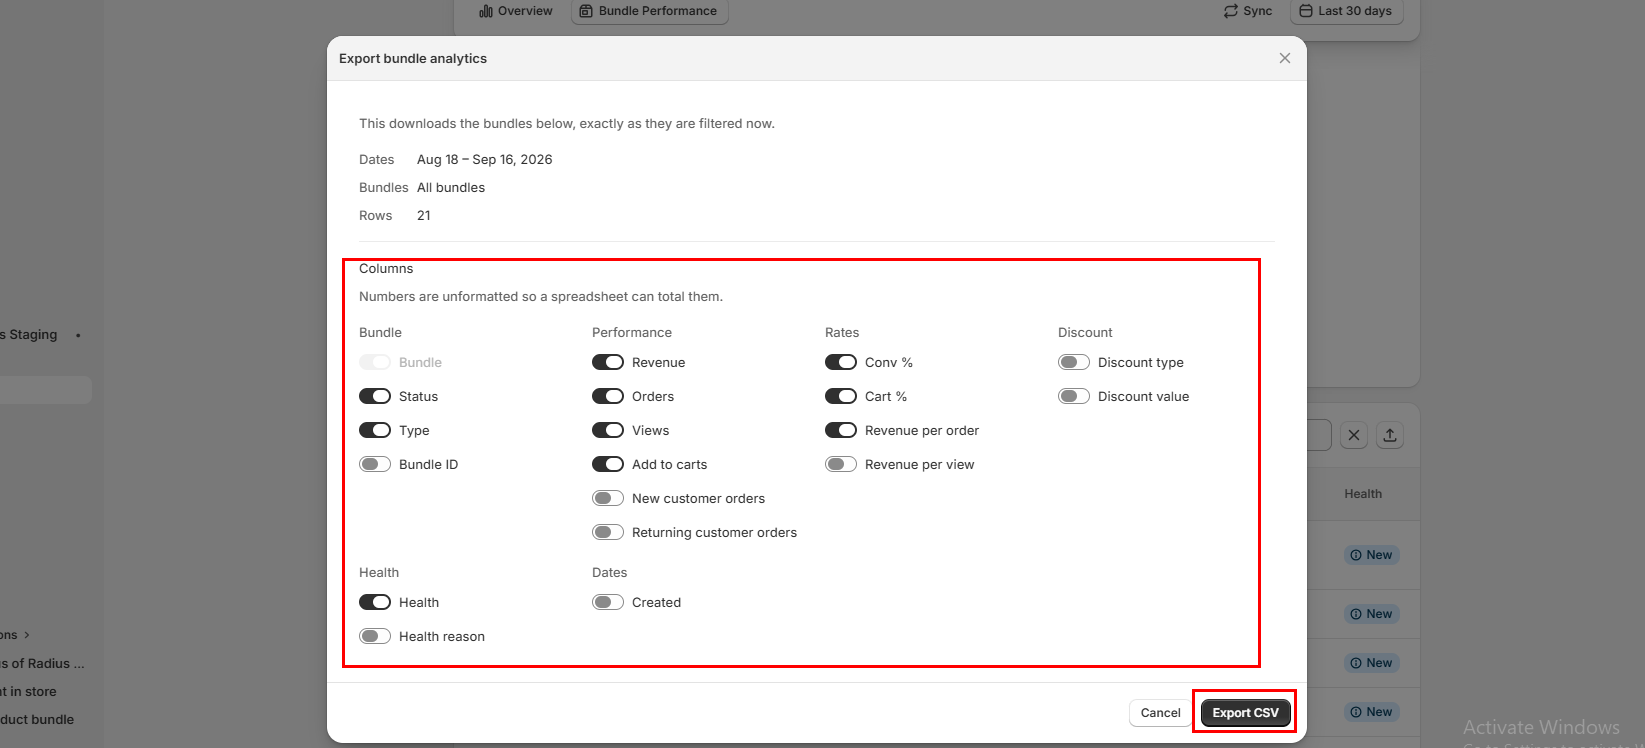
- Click the export icon. A confirmation modal opens. It shows the dates, the active search, and how many rows will be included.
- Choose your columns. Toggle switches in the modal to add or remove columns.
- Click
Export CSV. The file downloads to your browser’s downloads folder.
Available Columns #
| Column | Group | On by default | What it contains |
|---|---|---|---|
| Bundle | Bundle | Yes (locked) | Bundle name |
| Status | Bundle | Yes | DRAFT, ACTIVE, PAUSED, ARCHIVED, or SCHEDULED |
| Type | Bundle | Yes | Bundle type (e.g. FIXED_BUNDLE, BUY_X_GET_Y) |
| Bundle ID | Bundle | No | Internal ID |
| Revenue | Performance | Yes | Total revenue from purchases in the period, as a plain number |
| Orders | Performance | Yes | Total completed purchases in the period |
| Views | Performance | Yes | Total bundle widget views in the period |
| Add to carts | Performance | Yes | Total add-to-cart events in the period |
| New customer orders | Performance | No | Orders attributed to first-time customers |
| Returning customer orders | Performance | No | Orders attributed to returning customers |
| Conv % | Rates | Yes | Purchases ÷ views × 100, rounded to 2 decimal places |
| Cart % | Rates | Yes | Add-to-carts ÷ views × 100, rounded to 2 decimal places |
| Revenue per order | Rates | Yes | Revenue ÷ orders, rounded to 2 decimal places; 0 when there are no orders |
| Revenue per view | Rates | No | Revenue ÷ views, rounded to 2 decimal places; 0 when there are no views |
| Discount type | Discount | No | PERCENTAGE, FIXED_AMOUNT, CUSTOM_PRICE, NO_DISCOUNT, or QUANTITY_BREAKS |
| Discount value | Discount | No | Numeric value of the discount (percentage or amount) |
| Health | Health | Yes | healthy, needs-work, poor, or new |
| Health reason | Health | No | Text explanation of the health status |
| Created | Dates | No | Date the bundle was created, in YYYY-MM-DD format (UTC) |
The Bundle column is always included and cannot be removed. Column headers use the same names as the switches, in the language the app is shown in. Status, Type, Discount type and Health hold fixed codes rather than translated words, so filters built on them work in any language.
File Format #
- File name:
bundle-analytics-YYYY-MM-DD-to-YYYY-MM-DD.csv. The dates match the range you picked. - One row per bundle. All figures in a row are totals for the selected period.
- Numbers are unformatted. No currency symbol, no percent sign, no thousands separator. This lets spreadsheet formulas sum and average the values directly.
- Encoding: UTF-8 with a byte-order mark, so Excel reads special characters (accented letters, etc.) correctly.
Common Mistakes #
The numbers don’t match Shopify’s own reports. This app tracks events through its storefront widget. Shopify’s own reports count differently. Neither is wrong; they measure different things.
The file shows fewer rows than expected. Check whether a search filter is active. The modal shows “Matching …” under Bundles when a search is in effect. Clear the search field and re-export to get every bundle.
Rate columns show 0 for some bundles. Rates need at least one view (Revenue per order needs one order). A bundle with no views in the period shows 0 in every rate column, which means “no data”, not “0% conversion”.
Figures look odd in Excel. If Revenue or Orders appear as dates or formatted text, your spreadsheet is auto-formatting the column. The file itself has no formatting, so set the column type to Number after opening it.


